A faster way to trim a raster file
In the plot segmentation of image-based HTP platforms (e.g. UAV, ground-vehicle), we always need to trim a plot to remove the edge effect, then extracts the pixel values we are interesting. The operation is similar with cutline in gdalwarp command.
In R, raster package provides a function cellFromPolygon to extract cull numbers from a polygon. However, cellFromPolygon is slightly slow, especially for a larger file.
For example, the wheat plot from a 20M pixel Sony camera is about 3.4 MB. I want to trim this plot by 20% in each side.
library(raster)## Loading required package: sp## Warning: package 'sp' was built under R version 4.0.2# Define the polygon to trim raster file
ply <- read.table(textConnection('
434129.53992703213589 6950697.5565780829638
434127.33717670320766 6950693.9743350874633
434126.31413929269183 6950694.6008593635634
434128.51703721459489 6950698.1830912819132
434129.53992703213589 6950697.5565780829638'))
names(ply) <- c('long', 'lat')
plot <- brick('wheat-plot.tif')
# Plot the raster and polygon
plotRGB(plot)
lines(ply$long, ply$lat, col = 'red', lwd = 3)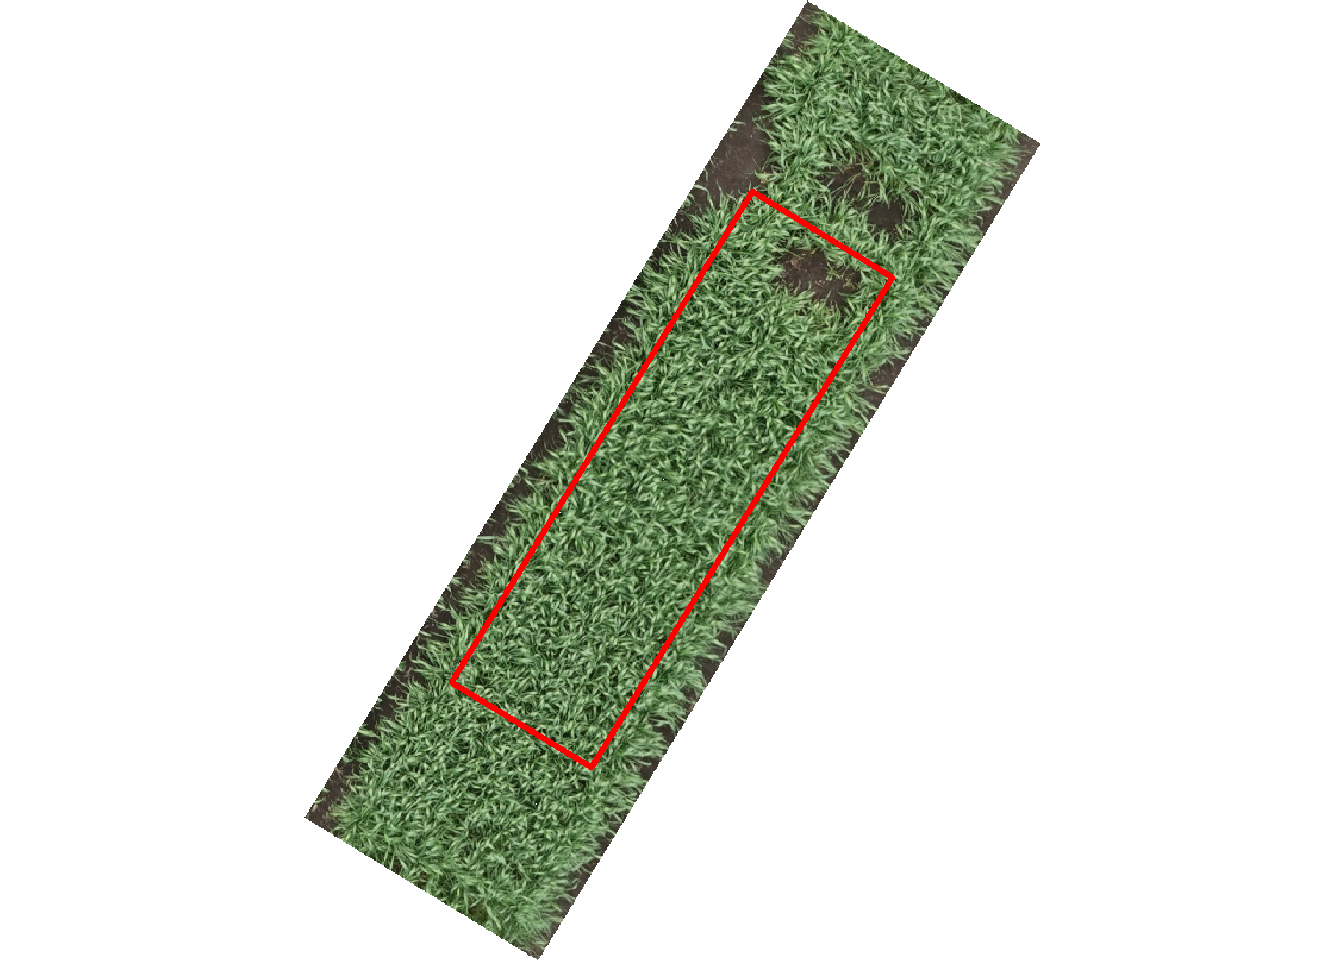
The first method is to use cellFromPolygon to extrct the cell index.
library(sp)
# Create spatial polygon
sply <- SpatialPolygons(list(Polygons(list(Polygon(ply)), ID = '1')),
proj4string = plot@crs)
system.time(cell_idx1 <- cellFromPolygon(plot, sply))## user system elapsed
## 0.30 0.00 0.29An alternative method is to use point.in.polygon function in sp package.
system.time({
# Generate a grid of all x and y values in the raster file
xy <- xyFromCell(plot, seq(1, prod(dim(plot)[1:2])))
# Check point in the polygon
cid <- point.in.polygon(xy[,1], xy[,2], ply[,1], ply[,2])
# Obtain the cell index
cell_idx2 <- seq(1, prod(dim(plot)[1:2]))[cid == 1]
})## user system elapsed
## 0.28 0.00 0.28The first method takes about 10 S, but the second method only takes less than 1s. The two methods generate the same results for the cell index.
library(tidyverse)## Warning: package 'tidyverse' was built under R version 4.0.2## -- Attaching packages --------------------------------------- tidyverse 1.3.0 --## v ggplot2 3.3.2 v purrr 0.3.4
## v tibble 3.0.3 v dplyr 1.0.1
## v tidyr 1.1.1 v stringr 1.4.0
## v readr 1.3.1 v forcats 0.5.0## Warning: package 'ggplot2' was built under R version 4.0.2## Warning: package 'tibble' was built under R version 4.0.2## Warning: package 'tidyr' was built under R version 4.0.2## Warning: package 'dplyr' was built under R version 4.0.2## -- Conflicts ------------------------------------------ tidyverse_conflicts() --
## x tidyr::extract() masks raster::extract()
## x dplyr::filter() masks stats::filter()
## x dplyr::lag() masks stats::lag()
## x dplyr::select() masks raster::select()pd <- xy %>%
as.data.frame() %>%
tbl_df() ## Warning: `tbl_df()` is deprecated as of dplyr 1.0.0.
## Please use `tibble::as_tibble()` instead.
## This warning is displayed once every 8 hours.
## Call `lifecycle::last_warnings()` to see where this warning was generated.pd %>%
slice(cell_idx1[[1]]) %>%
ggplot() +
geom_tile(aes(x, y), fill = 'red', alpha = 0.5) +
geom_tile(aes(x, y), fill = 'blue', alpha = 0.5,
data = pd[cell_idx2,]) +
coord_equal() +
theme_bw() +
xlab('') + ylab('')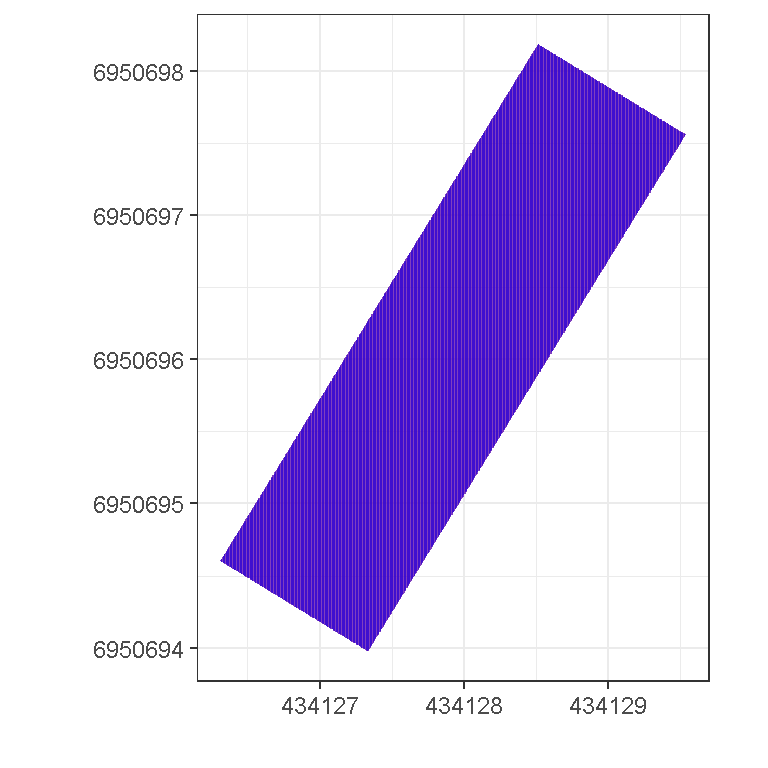
Bangyou Zheng
Data Scientist / Digital Agronomist
a research scientist of digital agriculture at the CSIRO.