Calculation of thermal time
The thermal time is important to quantify the crop growth for a specific period (e.g. from sowing to flowering). However, the codes might be complicated if there are multiple records in an experiment.
Here I showed how to use left_join function to easily calculate thermal time for the whole records in one data frame.
suppressPackageStartupMessages(library(weaana))
suppressPackageStartupMessages(library(tidyverse))Random observations are generated from 1957 and 2009 for sowing and flowering time.
obs <- tibble(sowing = as.Date(paste0(seq(1957, 2009), '-05-01')),
flowering = as.Date(paste0(seq(1957, 2009), '-', round(runif(53) * 20 + 210)),
format = "%Y-%j"))The weather records are stored in the APSIM format and red by weaana package.
records <- readWeatherRecords("WeatherRecordsDemo1.met") %>%
getWeatherRecords()The daily thermal time is calculated using base temperature 0C. The accumulated thermal times are summed up since the starting of weather records.
records <- records %>%
mutate(tt = ifelse(avgt > 0, avgt, 0),
cum_tt = cumsum(tt)) %>%
select(date, cum_tt)The accumulated thermal time at sowing and flowering are selected from the weather records. Then the thermal time from sowing to flowering is calcuated by the difference of accumulated thermal time at sowing and flowering.
sowing_tt <- obs %>%
left_join(records, by = c("sowing" = 'date')) %>%
rename(sowing_tt = cum_tt)
flowering_tt <- obs %>%
left_join(records, by = c("flowering" = 'date')) %>%
left_join(sowing_tt, by = c("sowing", 'flowering')) %>%
mutate(tt = cum_tt - sowing_tt) %>%
select(-cum_tt, -sowing_tt)
head(flowering_tt)## # A tibble: 6 x 3
## sowing flowering tt
## <date> <date> <dbl>
## 1 1957-05-01 1957-08-01 1337.
## 2 1958-05-01 1958-08-18 1707.
## 3 1959-05-01 1959-08-01 1316.
## 4 1960-05-01 1960-08-13 1390.
## 5 1961-05-01 1961-08-01 1242.
## 6 1962-05-01 1962-08-06 1412.flowering_tt %>%
ggplot() +
geom_histogram(aes(tt)) +
theme_bw() +
xlab("Thermal time (Cd)")## `stat_bin()` using `bins = 30`. Pick better value with `binwidth`.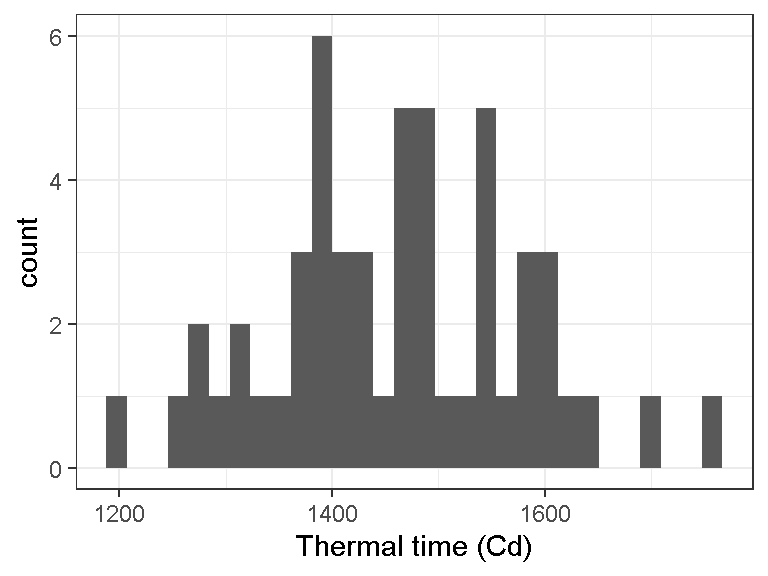
Bangyou Zheng
Data Scientist / Digital Agronomist
a research scientist of digital agriculture at the CSIRO.